Everything your team needs. One workspace.
Five pillars of institutional research: collaborative workspaces, cross-source correlation, market intelligence, portfolio oversight, and AI-assisted analysis.
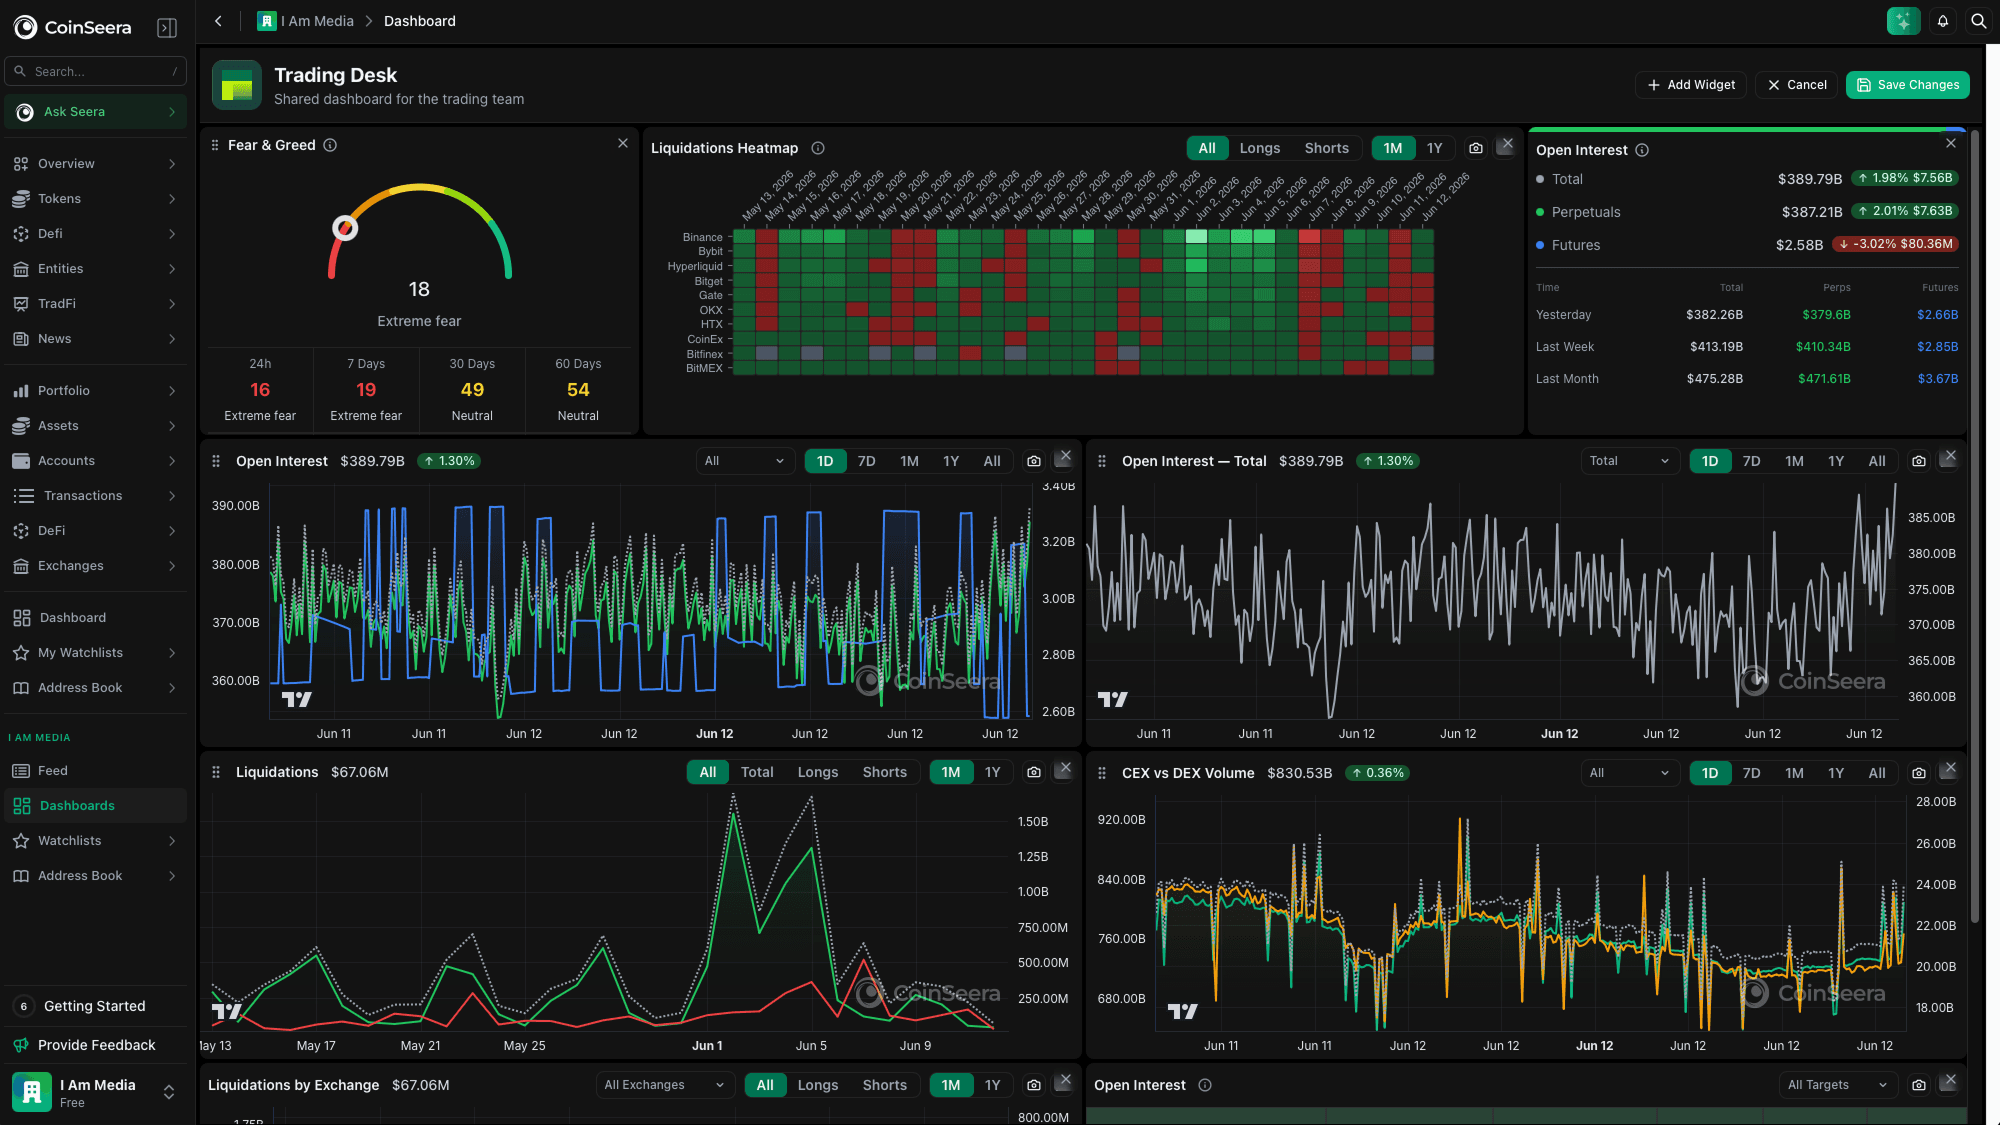
Research is a team sport. Your tools should know that.
Most crypto research tools are built for a single user in a single browser. Seerian is built for teams, where analysts can share context, build on each other's work, and keep every member of the desk aligned without duplicating effort or losing institutional knowledge.
Projects
Organise research into named, shared projects. Pin notes, addresses, and assets to a project context. Invite teammates with a single click. Archive completed projects without losing their data.
Shared watchlists
Create watchlists visible to your whole organisation. Layer in custom columns, alerts, and notes per asset. Subscribe teammates so they receive the same updates. Export any watchlist to CSV instantly.
Custom dashboards
Build bespoke views from any data module in the product. Save and share dashboards across the team. Set a dashboard as the team landing page. Resize and reorder widgets without code.
Organisation address book
Label and categorise wallet addresses once for the whole team. Attach notes and entity metadata to any address. Labels surface automatically across all data views. Import existing label lists via CSV.
Role-based access
Assign Admin, Analyst, or Viewer roles per member. Control which projects and portfolios each role can see. Audit-log every permission change. SSO support for enterprise organisations.
Activity feed
See what teammates added, edited, or flagged in real time. Comment inline on any note or data point. @mention colleagues to pull them into a thread. Receive daily digests of team activity by email.
Follow the money across every source. From one view.
Seerian aggregates data from 13+ on-chain, off-chain, and alternative sources, then surfaces the correlations that matter. Instead of toggling between six browser tabs to piece together a thesis, your team gets a single interface that links price action, flow data, entity behaviour, and sentiment into one coherent picture.
Cross-asset correlation
Compute rolling correlations across any set of assets, overlay on-chain flows with price and funding rate, and get flagged the moment a relationship breaks down. Export any matrix to CSV or Sheets.
Multi-asset compare
Normalise and compare up to 10 assets on a single chart, toggle price, volume, OI, or flows per asset, and annotate divergence points inline. Save any compare view for recurring analysis.
Entity drill-down
Click any entity label to pivot into a full profile with every associated address, flow, and exchange interaction. Link entities across chains and compare their behaviour across time windows.
Unified screeners
Screen on-chain, derivatives, and DeFi data in one table with compound AND/OR filters across sources. Save presets, share them with the team, and get alerted when results change.
The signals your desk cares about. Not the noise retail watches.
Seerian surfaces institutional-grade market and derivatives data across every major asset class in crypto and beyond. From perpetual funding rates to macro correlations, the data your desk relies on is a single click away, with no manual aggregation required.
Crypto markets
- Real-time and historical OHLCV data across 500+ pairs
- Exchange-level volume breakdown and dominance metrics
- Liquidation heatmaps and order book depth
- Cross-exchange price premium and arbitrage spreads
Derivatives
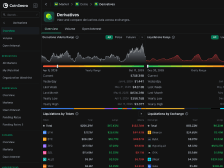
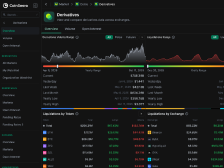
- Perpetual and dated futures open interest and volume
- Funding rate history and annualised carry across venues
- Options flow, put/call ratio, and implied volatility surface
- Basis and term structure across major assets
DeFi
- Protocol TVL trends and chain-level breakdown
- DEX volume, liquidity depth, and pool metrics
- Yield and borrow rates across lending protocols
- Bridge flows and cross-chain capital movement
Sentiment & technical indicators
- Social volume, weighted sentiment, and mention velocity
- Fear & greed index with historical context
- Technical overlays: RSI, MACD, Bollinger Bands, and more
- Custom indicator builder for proprietary signals
Traditional markets
- Major equity indices and macro asset prices in one view
- Crypto-equities correlation and beta analysis
- FX and rates context alongside digital asset data
- Scheduled macro event calendar with impact scoring
News & research
- Aggregated headlines from 40+ crypto and macro news sources
- AI-generated summaries with source attribution
- Research report library from leading crypto firms
- Filter by asset, entity, or topic across all news sources
Entities
- Profiles for exchanges, protocols, funds, and miners
- On-chain flow attribution to known institutional entities
- Entity-level news and event history
- Custom entity tagging for proprietary counterparties
Every position. Every source. One view.
Whether your exposure lives in cold wallets, CeFi exchanges, or DeFi protocols, Seerian consolidates it into a single portfolio view, updated in real time, shared across your desk, and always reconciled against live market prices.
Multi-source tracking
- Connect wallets, exchanges, and DeFi positions in minutes
- Read-only API and address-based integrations only
- Auto-detect new assets and positions as they appear
- Manual entry for OTC or off-platform positions
Portfolio overview
- Consolidated P&L, allocation, and exposure in one table
- Mark positions to live, VWAP, or cost-basis price
- Drill into any asset to see source-level breakdown
- Historical snapshots for performance attribution
DeFi positions
- Automatically detect LP, lending, staking, and vault positions
- Show underlying asset breakdown for LP tokens
- Surface impermanent loss, accrued yield, and health factors
- Alert on liquidation threshold proximity
Exchange positions
- Spot, margin, and derivatives positions in one consolidated view
- Funding cost attribution per perpetual position
- Cross-exchange net exposure by asset
- Margin utilisation and available collateral tracking
Transaction history
- Unified transaction log across all connected sources
- Filter by date, asset, type, and counterparty
- Tag transactions with internal labels and cost categories
- Export for reconciliation or tax reporting workflows
Shared portfolio views
- Share a read-only portfolio view with stakeholders
- Control which assets or positions are visible per share link
- Set expiry dates on shared links for time-bounded reporting
- Export any portfolio snapshot to CSV or PDF
Ask your data anything. Get answers grounded in live market state.
Seera AI is the research analyst that never sleeps. It draws on the data sources connected in Seerian and can answer natural language questions about your portfolio, the market, or any entity, returning responses that are grounded in live data, not stale training weights.
Conversational research
Ask questions in plain English across every data module and get responses that cite the underlying source and timestamp. Follow-ups keep full context, and you can drill into any answer to see the raw data behind it.
Prompt library
Start from pre-built prompts for common institutional research tasks, then save and share your own across the organisation. Parameterise prompts with asset or date variables and tap a community library updated regularly.
Chat history
Every conversation is saved and searchable by keyword. Share a thread with a teammate for collaborative review, pin important conversations to a project, and export any history as formatted research notes.
Upcoming: MCP integration
Expose Seerian data to any MCP-compatible AI client and use your preferred LLM interface with Seerian as the data layer. Build custom agentic workflows on live market data, with early access available for enterprise customers.
Core capabilities
Five pillars that carry your desk from raw data to decision, all in one workspace.
A workspace your whole team can live in
Give every seat the right level of access and organize research by thesis. Keep every chart, address, and memo linked in one shared place, so work hands off without a single screenshot.
One workspace. Every source. Correlated.
Pull every source you already trust into one surface, correlate what others keep siloed, and see the market through the lens of your portfolio.
We aggregate the data you already trust.
Seerian pulls from Nansen, Arkham, CoinGlass, Dune, DefiLlama, CryptoRank, StakingRewards, Etherscan, DeBank, CoinGecko, CoinMarketCap, DEX Screener, and X. You're not replacing your stack; you're giving your team a single surface to work across it.
We correlate what others keep siloed.
Look at an exchange and follow its on-chain flows. Drill into the chains it settles on. Map the DEXes on those chains. Pull the open interest and funding rates on the derivatives listed against its reserves. No other product connects these dots, because no other product was built to.
We show you the market through the lens of your portfolio.
Every dashboard in the space shows you broad market data. None of them connect it to what you actually hold. Seerian surfaces portfolio-level insights: how market movements, funding rates, liquidation events, and on-chain flows relate to your positions, your thesis, and your exposure. The question isn't "what's happening in the market?", it's "what does this mean for us?"
We made it a workspace, not a dashboard.
Your team creates projects around the research they're actually doing, from tokenized gold to a new L2 thesis to an exchange due diligence, and pulls every relevant chart, watchlist, note, and address into one place. When a PM asks "where are we on this," the answer is a link.
Coverage that matches the breadth of your mandate.
From crypto and traditional markets to research and intelligence, every source your desk needs sits in one place.
Crypto
- 50+ chains (Bitcoin, Ethereum, Solana, all major L1/L2)
- Every major centralized exchange
- Derivatives: futures, perpetuals, options data
- DeFi: protocols, pools, TVL, yields
- Validators, staking, unlocks, airdrops
- Token transfers, smart money activity
Traditional markets
- Equities by sector
- Bonds
- Commodities
- Forex (with heatmap)
- Indices
- ETFs
Research & intelligence
- Real-time news with source tracking
- VC activity (funds, raises)
- Token unlock calendar
- Entity database (VCs, DATs, exchanges)
- X (Twitter) integration
Trusted by desks managing digital assets at scale.
See how leading desks research, track, and manage digital assets with Seerian.
“Seerian has completely transformed how our research team tracks on-chain flows. What used to take hours now takes minutes.”

“The unified dashboard across exchanges and wallets gives us a single source of truth. Our portfolio managers finally have real-time clarity.”
“Building earning strategies means constantly researching new protocols, assets, and pools. Seerian puts all of that data in one place, so our team can compare opportunities and move faster than ever.”
Frequently asked questions
Answers to the questions teams ask most when evaluating Seerian.
Ready to see the full product?
Book a 30-minute demo. We'll walk through the features that matter most to your team's workflow.